Demultiplex cell-hashing/nuclei-hashing data using demuxEM or prepare for CITE-Seq analysis
Follow the steps below to run cumulus for cell-hashing/nuclei-hashing/CITE-Seq data on Terra.
Run Cell Ranger tool to generate raw gene count matrices and antibody hashtag data.
Please refer to the cellranger_workflow tutorial for details.
When finished, you should be able to find the raw gene count matrix (e.g.
raw_gene_be_matrices_h5.h5) and ADT count matrix (e.g.sample_1_ADT.csv) for each sample.Create a sample sheet, sample_sheet_hashing.csv, which describes the metadata for each pair of RNA and antibody hashtag data. The sample sheet should contain 4 columns — OUTNAME, RNA, ADT, and TYPE. OUTNAME is the output name for one pair of RNA and ADT data. RNA and ADT are the raw gene count matrix and the ADT count matrix generated in Step 1, respectively. TYPE is the assay type, which can be
cell-hashing,nuclei-hashing, orcite-seq.Example:
OUTNAME,RNA,ADT,TYPE
sample_1,gs://fc-e0000000-0000-0000-0000-000000000000/my_dir/sample_1/raw_gene_bc_matrices_h5.h5,gs://fc-e0000000-0000-0000-0000-000000000000/my_dir/sample_1_ADT/sample_1_ADT.csv,cell-hashing
sample_2,gs://fc-e0000000-0000-0000-0000-000000000000/my_dir/sample_2/raw_feature_bc_matrices.h5,gs://fc-e0000000-0000-0000-0000-000000000000/my_dir/sample_2_ADT/sample_2_ADT.csv,nuclei-hashing
Note that in the example above, sample_2 is 10x genomics’ v3 chemistry. Cumulus can automatically detect v2/v3 chemistry when loading hdf5 files.
Create an additional antibody-control sheet antibody_control.csv if you have CITE-Seq data. This sheet contains 2 columns — Antibody and Control.
Example:
Antibody,Control
CD8,Mouse-IgG1
HLA-ABC,Mouse-IgG2a
CD45RA,Mouse-IgG2b
Upload your sample sheets to the Google bucket of your workspace.
Example:
gsutil cp /foo/bar/projects/my_sample_sheet_hashing.csv gs://fc-e0000000-0000-0000-0000-000000000000/
gsutil cp /foo/bar/projects/antibody_control.csv gs://fc-e0000000-0000-0000-0000-000000000000/
Import cumulus_hashing_cite_seq to your workspace.
See the Terra documentation for adding a workflow. The cumulus_hashing_cite_seq workflow is under
Broad Methods Repositorywith name “cumulus/cumulus_hashing_cite_seq”.Moreover, in the workflow page, click the
Export to Workspace...button, and select the workspace to which you want to export cumulus_hashing_cite_seq workflow in the drop-down menu.In your workspace, open
cumulus_hashing_cite_seqinWORKFLOWStab. SelectProcess single workflow from filesas below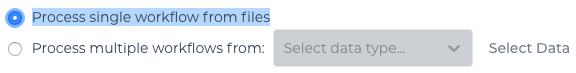
and click the
SAVEbutton.
cumulus_hashing_cite_seq inputs:
| Name | Description | Example | Default |
|---|---|---|---|
| input_sample_sheet | Input CSV file describing metadata of RNA and ADT data pairing | “gs://fc-e0000000-0000-0000-0000-000000000000/sample_sheet_hashing.csv” | |
| output_directory | This is the output directory (gs url + path) for all results. There will be one folder per RNA-ADT data pair under this directory | “gs://fc-e0000000-0000-0000-0000-000000000000/my_demux_dir” | |
| genome | Reference genome name. If not provided, cumulus will infer the genome name from data | “GRCh38” | |
| demuxEM_min_num_genes | demuxEM parameter. Only demultiplex cells/nuclei with at least <demuxEM_min_num_genes> expressed genes | 200 | 100 |
| demuxEM_alpha_on_samples | demuxEM parameter. The Dirichlet prior concentration parameter (alpha) on samples. An alpha value < 1.0 will make the prior sparse. | 2.0 | 0.0 |
| demuxEM_min_num_umis | demuxEM parameter. Only demultiplex cells/nuclei with at least <demuxEM_min_num_umis> of UMIs. | 200 | 100 |
| demuxEM_min_signal_hashtag | demuxEM parameter. Any cell/nucleus with less than <count> hashtags from the signal will be marked as unknown. [default: 10.0] | 10.0 | 10.0 |
| demuxEM_random_state | demuxEM parameter. The random seed used in the KMeans algorithm to separate empty ADT droplets from others | 0 | 0 |
| demuxEM_generate_diagnostic_plots | demuxEM parameter. If generate a series of diagnostic plots, including the background/signal between HTO counts, estimated background probabilities, HTO distributions of cells and non-cells etc | true | true |
| demuxEM_generate_gender_plot | demuxEM parameter. If generate violin plots using gender-specific genes (e.g. Xist). <demuxEM_generate_gender_plot> is a comma-separated list of gene names | “XIST” | |
| antibody_control_csv | merge_rna_adt parameter. This is a CSV file containing the IgG control information for each antibody. | “gs://fc-e0000000-0000-0000-0000-000000000000/antibody_control.csv” | |
| cumulus_version | cumulus version to use. Versions available: 0.10.0. | “0.10.0” | “0.10.0” |
| docker_registry | Docker registry to use. Options:
|
“cumulusprod/” | “cumulusprod/” |
| zones | Google cloud zones | “us-east1-d us-west1-a us-west1-b” | “us-east1-d us-west1-a us-west1-b” |
| num_cpu | Number of CPUs per cumulus_hashing_cite_seq job | 8 | 8 |
| memory | Memory size string | “10G” | “10G” |
| disk_space | Total disk space in GB | 20 | 20 |
| preemptible | Number of preemptible tries | 2 | 2 |
cumulus_hashing_cite_seq outputs
See the table below for important cumulus_hashing_cite_seq outputs:
| Name | Type | Description |
|---|---|---|
| output_folder | Array[String] | A list of google bucket urls containing results for every RNA-ADT data pairs. |
In the output folder of each cell-hashing/nuclei-hashing RNA-ADT data pair, you can find the following files:
| Name | Description |
|---|---|
| output_name_demux.h5ad | Demultiplexed RNA count matrix in h5ad format. |
| output_name_demux.h5sc | RNA expression matrix with demultiplexed sample identities in cumulus hdf5 (h5sc) format. |
| output_name_ADTs.h5ad | Antibody tag matrix in h5ad format. |
| output_name.ambient_hashtag.hist.png | Optional output. A histogram plot depicting hashtag distributions of empty droplets and non-empty droplets. |
| output_name.background_probabilities.bar.png | Optional output. A bar plot visualizing the estimated hashtag background probability distribution. |
| output_name.real_content.hist.png | Optional output. A histogram plot depicting hashtag distributions of not-real-cells and real-cells as defined by total number of expressed genes in the RNA assay. |
| output_name.rna_demux.hist.png | Optional output. A histogram plot depicting RNA UMI distribution for singlets, doublets and unknown cells. |
| output_name.gene_name.violin.png | Optional outputs. Violin plots depicting gender-specific gene expression across samples. We can have multiple plots if a gene list is provided in demuxEM_generate_gender_plot field of cumulus_hashing_cite_seq inputs. |
In the output folder of each CITE-Seq RNA-ADT data pair, you can find the following file:
| Name | Description |
|---|---|
| output_name.h5sc | A Cumulus hdf5 format (h5sc) file containing both RNA and ADT count matrices. |
Load demultiplexing results into Python and R
To load demultiplexing results into Python, you need to install Python package anndata first. Then follow the codes below:
import anndata
data = anndata.read_h5ad('output_name_demux.h5ad')
Once you load the data object, you can find predicted droplet types (singlet/doublet/unknown) in data.obs['demux_type']. You can find predicted sample assignments in data.obs['assignment']. You can find estimated sample fractions (sample1, sample2, …, samplen, background) for each droplet in data.obsm['raw_probs'].
To load the results into R, you need to install R package reticulate in addition to Python package anndata. Then follow the codes below:
library(reticulate)
ad <- import("anndata", convert = FALSE)
data <- ad$read_h5ad("output_name_demux.h5ad")
Results are in data$obs['demux_type'], data$obs['assignment'], and data$obsm['raw_probs'].